How to carry out data acquisition configuration and field test application? I understand it completely.
From the aspects of configuration, testing, communication, display, storage, etc., this paper describes the six problems that engineers often encounter in the data acquisition recorder test. This paper can cope with the common abnormalities of the data acquisition test. This series will be continuously updated. This article starts from the operation of the data acquisition recorder interface setting, whether it is in the DP100 screen operation or the PC side through the Web browser operation, you need to select automatic or manual configuration in the set "board configuration".
Then, the parameters such as the AI ​​channel can be set according to the actual test requirements, as shown in Figure 2.
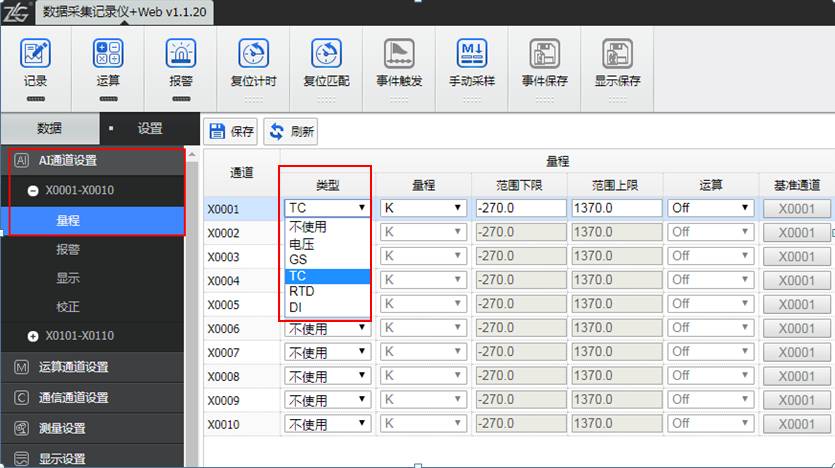
Figure 2 channel settings
First, on the data acquisition module configuration
Up to 200 channels can be configured for both DP100 and DM100. Pay attention to the test requirements when configuring the module. There are three points to note:
The DM100 host needs to be configured with a power module. The DP100 host does not need to be configured.
When the DP100 test channel exceeds 30 (or 3 modules), the expansion module needs to be configured, and the expansion module requires the power module to supply power.
When the number of customer test channels is relatively large, for example, 100, you need to understand the test environment, and properly configure the expansion module to achieve reasonable configuration, as shown in Figure 3.
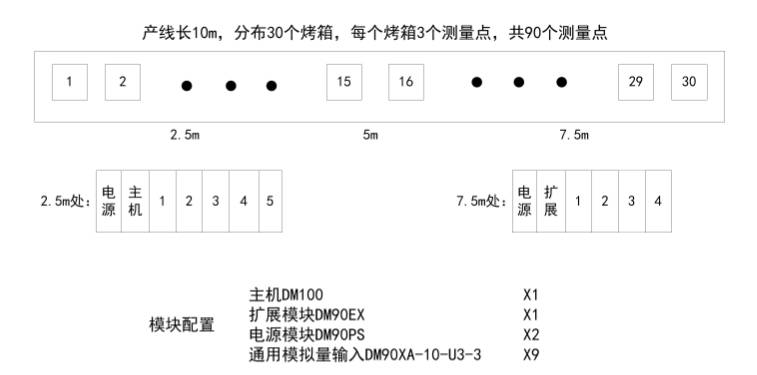
Figure 3 oven line temperature test
Second, the interface shows positive overflow or positive/negative break
As shown in Figure 4, the interface displays X0101/X0102/X0103 three channels showing positive overflow, positive break, and negative break. This phenomenon is caused by the disconnection, unwiring or poor contact of the thermocouple, and it can be solved by confirming the number of terminals.
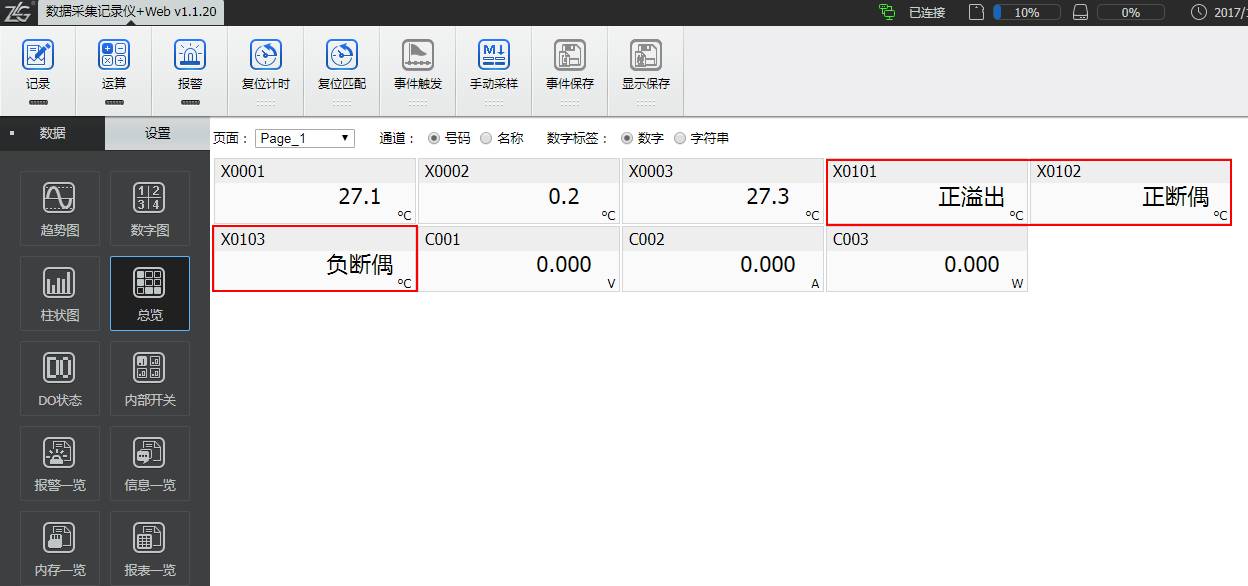
Figure 4 broken couple display
The positive overflow, positive break, and negative break of the three-channel display are set as shown in FIG. 5.
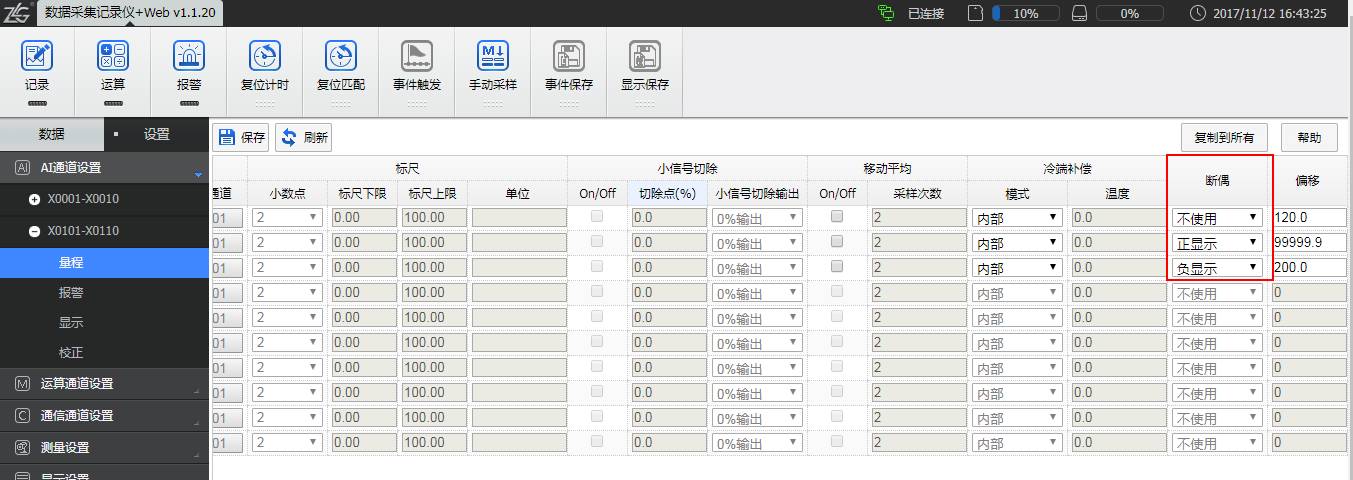
Figure 5 Breaking the setting
Select “Do not useâ€: When the sensor is broken, the measured value is displayed as “positive overflowâ€;
Select “Positive displayâ€: When the sensor is broken, the measurement result is fixed to the positive range overflow value. The measured value is displayed as "positive break";
Select “Positive displayâ€: When the sensor is broken, the measurement result is fixed to the negative range overflow value. The measured value is displayed as "negative break".
Third, on the temperature rise test
1, the main steps
As shown in Figure 7, the second channel (X0002) shows the value of "temperature rise". The main steps are as follows:
Under "AI channel", enter "Range", select the operation as Delta, and set the reference channel to X0001, as shown in Figure 6.
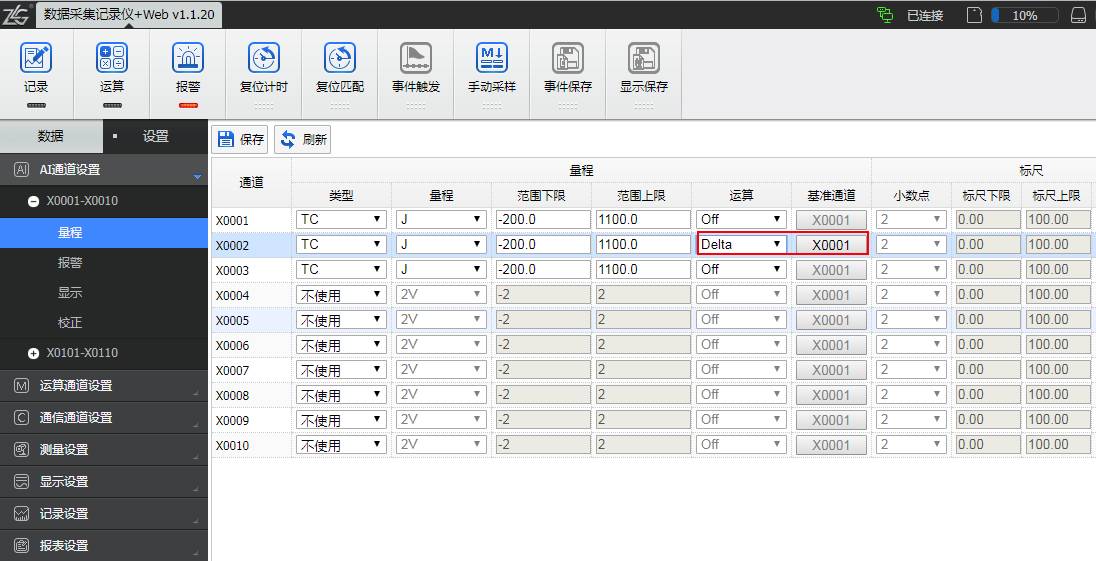
Figure 6 Delta operation settings
Enter the "overall interface", you can see that the X0002 display value is the temperature rise value of 7.6 °C (X0001 is suspended in the air, the ambient temperature. At this time, holding the 2-channel thermocouple, X0002 temperature rises to the hand temperature minus the ambient temperature) , as shown in Figure 7.
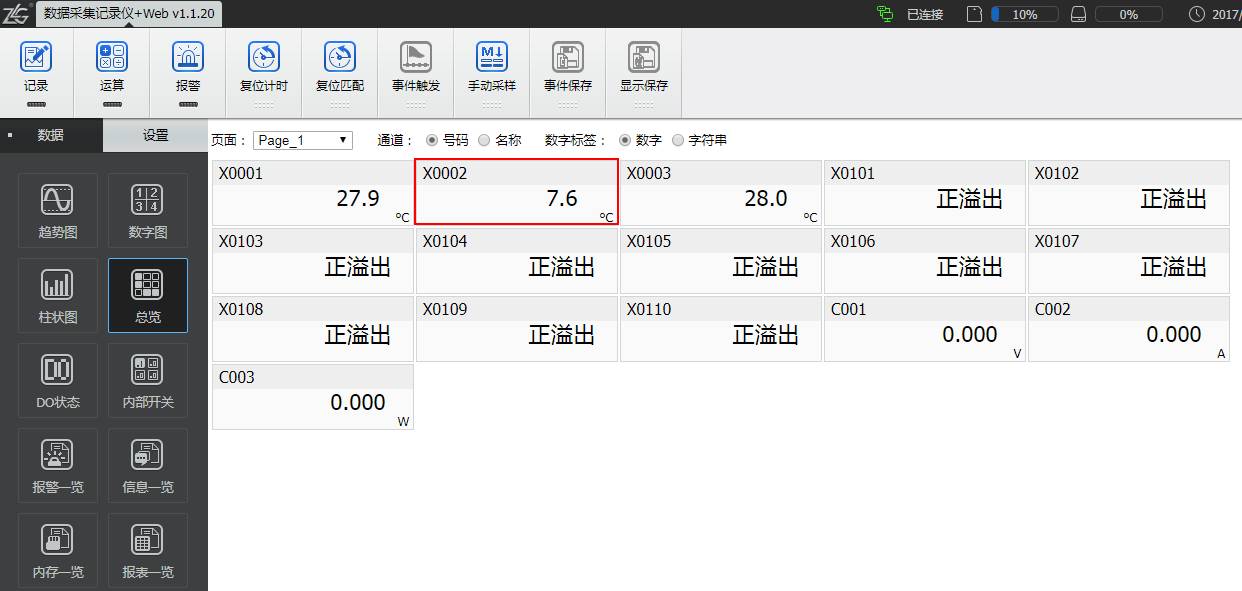
Figure 7 Delta operation temperature rise display
2, the main role
This operation can save the engineer from using the EXCEL formula to calculate the temperature rise value after the data is exported, and improve the efficiency;
Test values ​​are more accurate in real time due to changes in the ambient temperature.
Fourth, on the information mark in the trend chart
As shown in FIG. 8 , in the display setting of the setting interface, select “information settingâ€, for example, setting the information number 1/2 to start/end respectively;
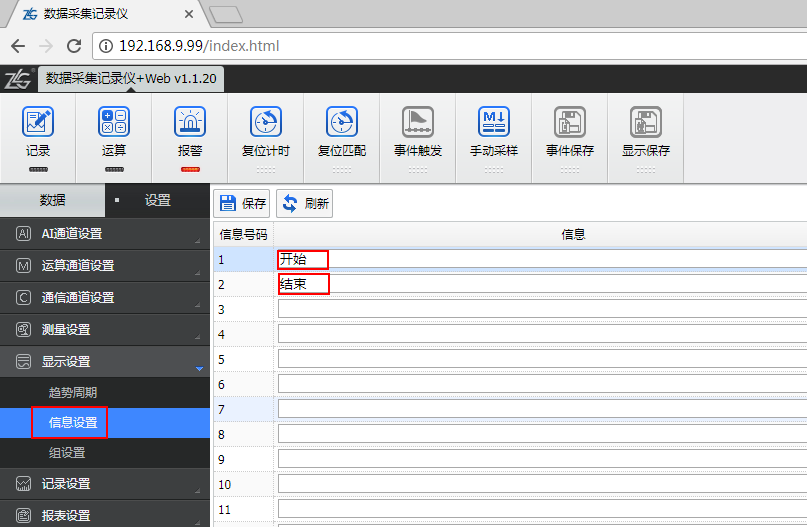
Figure 8 tag information settings
As shown in FIG. 9, click on the desired mark in the trend graph of the data interface, and select the required information for marking.
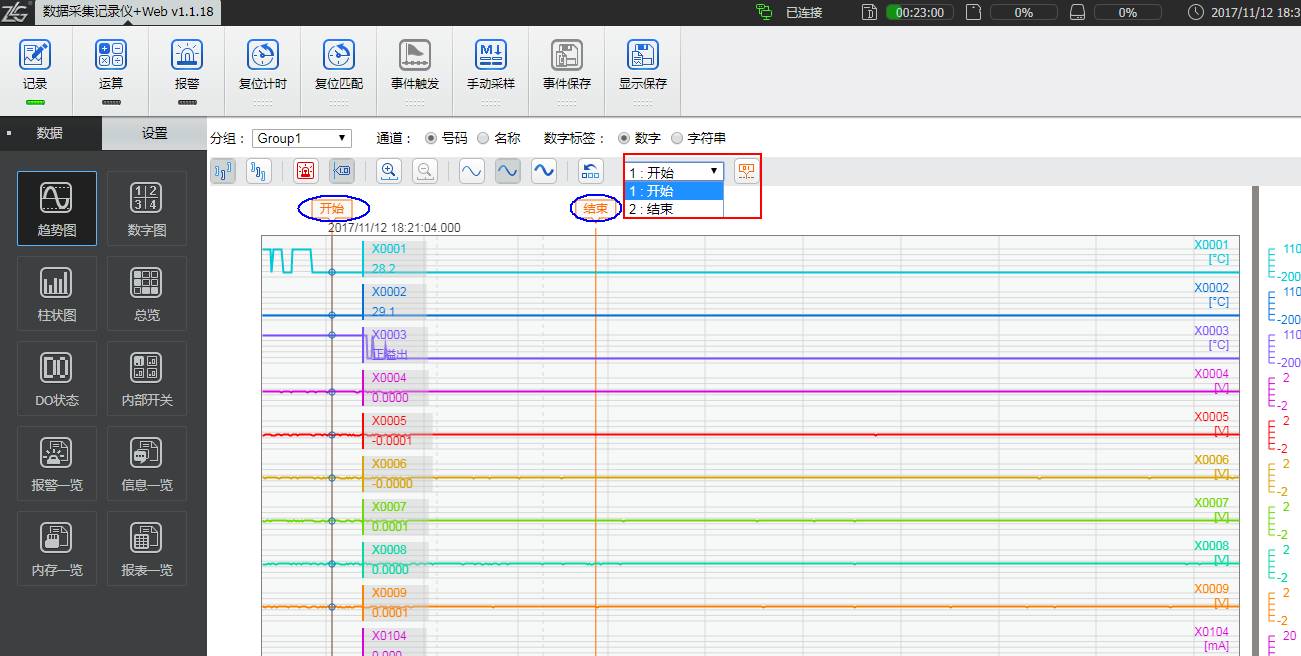
Figure 9 Information tag
The information tag is similar to the oscilloscope's Mark, making it quick and easy to find the points of interest that you have marked.
V. Communication on data mining
There are three main types of communication between digital acquisition and external equipment:
Communicate with the "Zhiyuan Power Meter": use the SCPI command through Ethernet, the specific operation is the sixth point: about the power meter connected to our power meter;
Communicate with other devices: use the Modbus protocol over Ethernet to read device values ​​from registers;
Communicate with other devices: Use the Modbus protocol through the serial port to read the device values ​​from the registers (DP100 supports RS485/422/232, DM100 supports RS485/422/).
The general interface settings are shown in Figure 10.
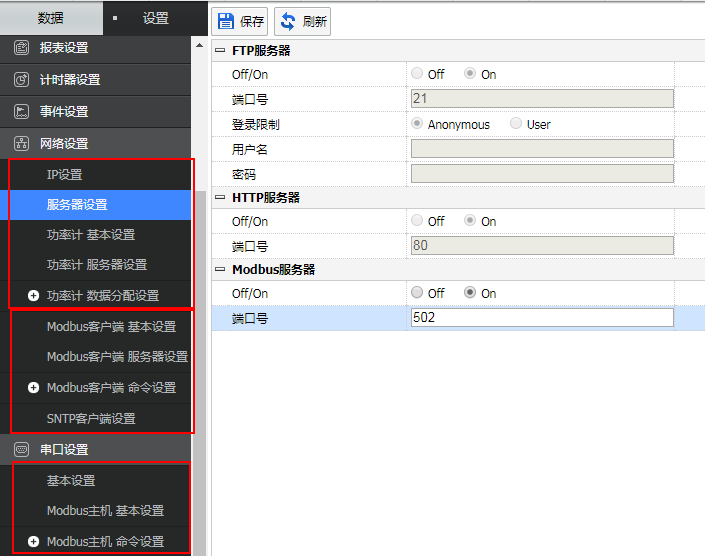
Figure 10 Data acquisition and external device communication settings interface
Another: When using Modbus communication over the Ethernet interface on TCP/IP, the two devices are called the client and the server respectively. When using Modbus communication through the serial port on the serial link, the two devices are called the master and the slave respectively.
Sixth, about the digital mining connection our power meter
1, the main steps are as follows
Set the IP of the computer, data acquisition, and power meter on the same network segment (this step requires three interfaces of the router or switch, one end of the network cable is connected to the computer, the power meter and the data acquisition, and the other end is connected to the router or the switch. Network port can be);
Enter the number of IP in the browser address bar, enter the connection interface and select “Network Settings†in “Settingsâ€. After entering, select “Power Meter Basic Settings†to make the power meter function “Onâ€, as shown in Figure 11;
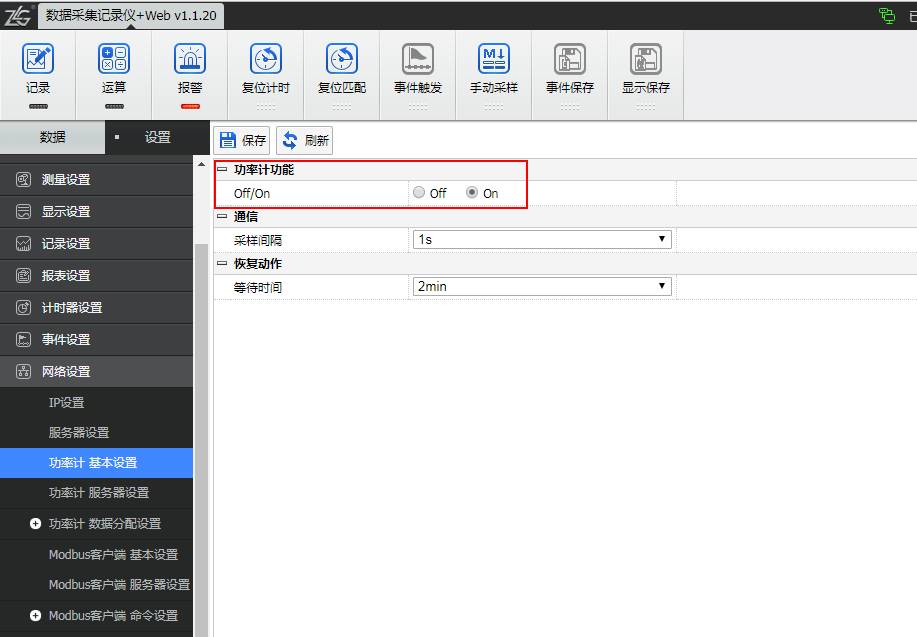
Figure 11 Power meter function is on
Select "Power Meter Server Settings", enter the interface, select "On" for "Server", and set the server IP (ie power meter IP), and select the corresponding power meter model, as shown in Figure 12;
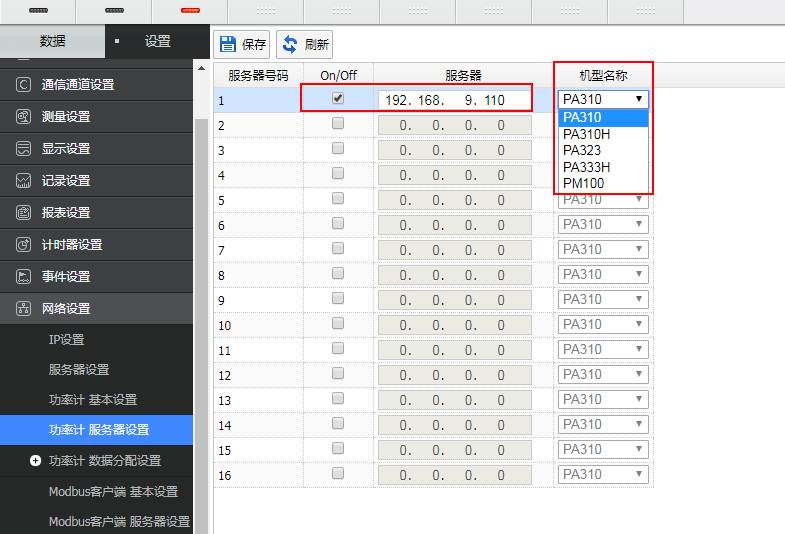
Figure 12 Power Meter Server Settings
Go to the "Power Meter Data Distribution Settings", select the server number set in the previous step, and then set the "data group name", "data name", "exponential zoom", "communication channel" (the communication channel is used to display the slave power meter). The value read), as shown in Figure 13;
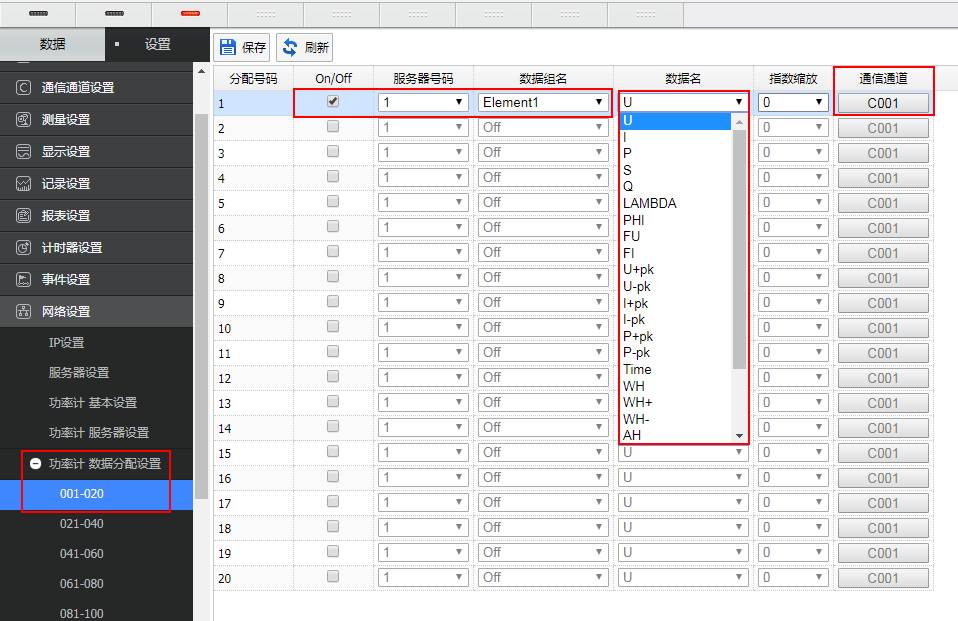
Figure 13 Power Meter Data Distribution Settings
In the “Settings†interface, switch to “Communication Channel†and set the corresponding parameters in “Rangeâ€, the focus is “Upper/Lower Limitâ€, as shown in Figure 14;
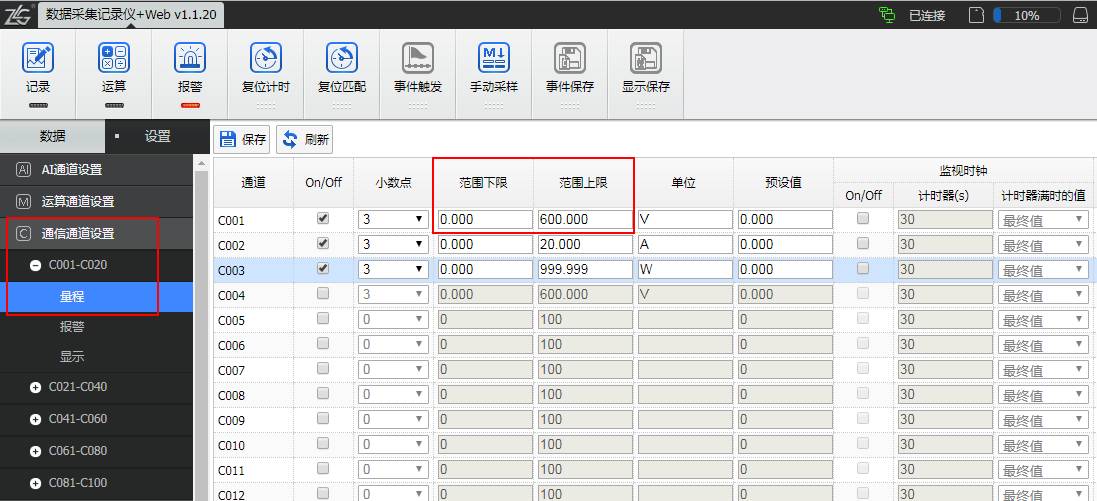
Figure 14 Communication channel settings
After setting, switch to the “Overview†interface of the “Data†interface. In the corresponding “Communication Channel (such as C001, C002)â€, you can see the power count value collected by the data acquisition, as shown in Figure 15.
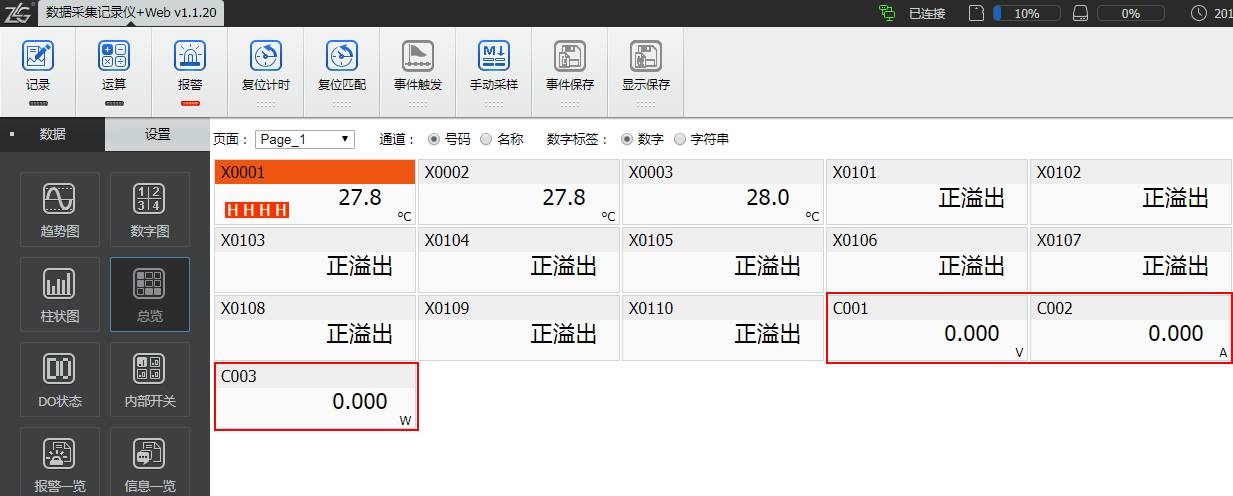
Figure 15 Communication channel value display
Note: Since the data acquisition and power meter use the network cable communication as the SCPI command, it is necessary to turn off the Modbus of the power meter (in the interface button).
2, the main role
It is convenient to compare the voltage, current, power, etc. with the temperature at this time. For example, you need to see if the temperature value of a certain point at a certain power exceeds the limit.
48V20Ah Lithium Ion Battery,48V 20Ah Lithium Iron Electric Bicycle Battery,48V20Ah Electrict Scooter Battery,Lifepo4 Lithium Battery 48V20A
Jiangsu Zhitai New Energy Technology Co.,Ltd , https://www.zhitainewenergy.com